

Model Relationships
The process of "mashing up" data fundamentally requires users to interconnect the various data sets they have from one or more sources so as to build a singular framework that allows them to cross analyze the data from the various data points.
To achieve the mash-up, logical relationships or "joins" need to be made between the data sets to provide the modeling tools with the information on how to glue the pieces together - which in turn makes the process of data discovery simpler and effective.
The Relationship viewer and tool in BI Office is designed to achieve this capability.
Using the Relationship Tool
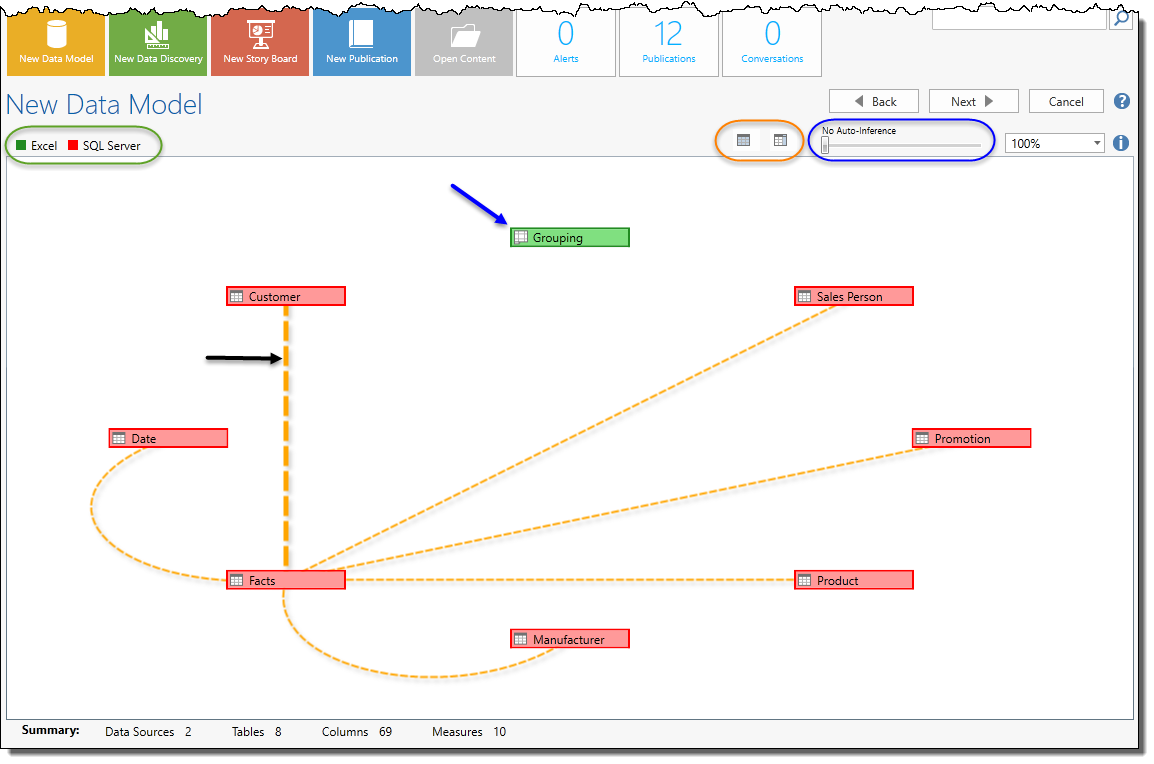
The relationship tool will show each of the individual data sets as boxes in a circular pattern (blue arrow below).
- Each data set is colored by its matching data source type (green highlight).
- To see more details on each data set, click the table view buttons (orange highlight).
- Inherent or detected joins between data sets are shown as yellow lines between the data sets (black arrow). To create missing joins between the data sets, move the heuristic slider (blue highlight). See below for more details.
Adding Relationship Joins
To add missing joins between data sets, users can add them manually by dragging the mouse between data set boxes or using the heuristic join slider.
Manually added joins are shown with red lines (blue arrow).
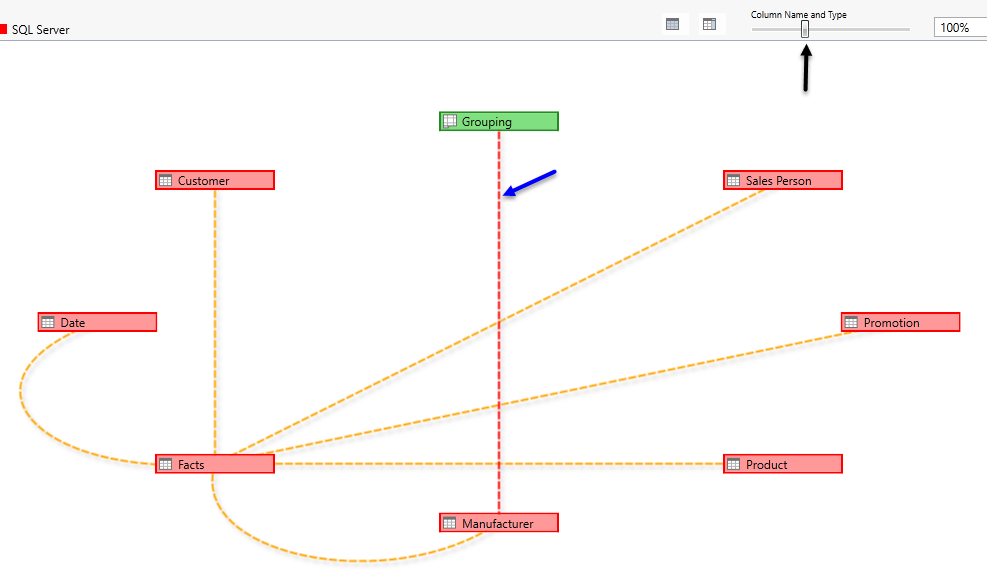
The Heuristics Slider (black arrow) enables you to auto-determine relationships. By sliding the marker, you can auto determine the join using 3 formulations:
- Column Name & Type
- Column Name & Table Name
- Match by First Column
Regardless of how the join is created, it can be edited by right licking on the join line.
Editing Relationships
Double-click or right-click a line to edit it (blue arrow). The menu will also allow you to delete it.
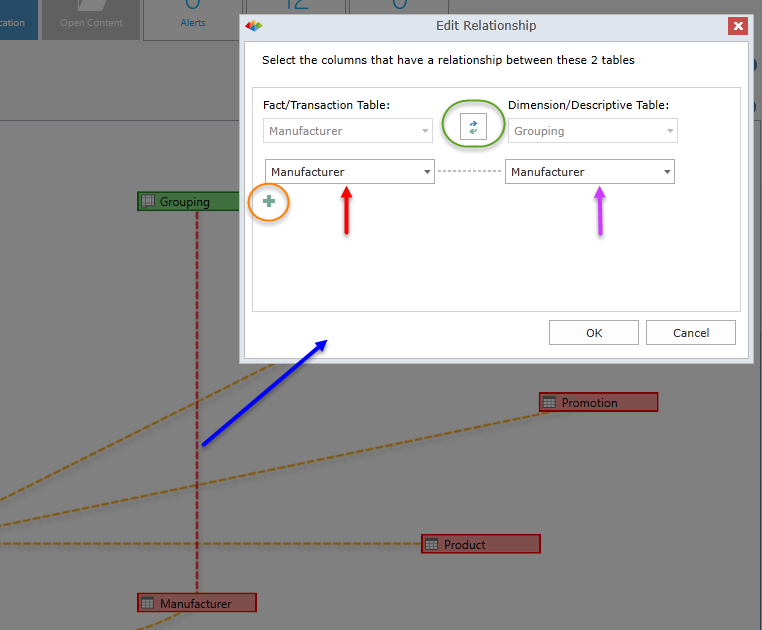
- In the dialog you can choose upon which fields/columns/attributes from each data set should be used to make the join. (red and purple arrows).
- To add multiple join fields, click the plus button (orange highlight) and set the join fields.
- Its important to set which data set is the transactional table (fact) and which is descriptive (dimension). Use the green arrows (green highlight) to swap them, around.
Home |
Table of Contents |
Index |
User Community
Pyramid Analytics © 2011-2022