

Model Measures
Any column can be used to generate metrics that will ultimately become part of the analyses driven off the data model in Data Discovery.
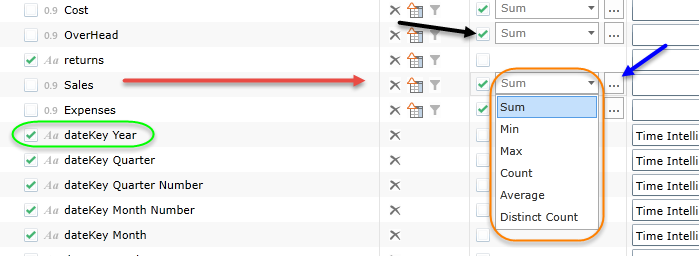
Measures are created by checking measures option for each column (black arrow below) in the column selector stage of the modeling.
NOTE: The BI Office modeling heuristics engine will often auto determine whether a field should be a measure or not. When it is selected as a measure, the engine normally sets the source column to hidden. These can be manually overridden.
Standard Model Measures
Once activated, a measure drop down is presented (orange highlight above) for the user to make a QUICK selection of the aggregation model that is to be applied to this columns values. The choices vary by column data type:
- Numeric columns can be used to generate measures like
-
- Sum – adds the values in the column. This is also the default for numeric columns.
- Average – takes an average of the values in the column
- Minimum – takes the minimum value in the column
- Maximum – takes the maximum value in the column
- Count – counts the values in the column
- Distinct Count – counts the distinct values in the column
- Text columns can be used to generate measures like
- Count – counts the values in the column.
- Distinct Count – counts the distinct values in the column. This is also the default for text.
- Date and Time columns can be used to generate measures like
- Count – counts the dates in the column
- Distinct Count – counts the distinct dates in the column. This is also the default for dates.
- Minimum – takes the minimum date in the column
- Maximum – takes the maximum date in the column
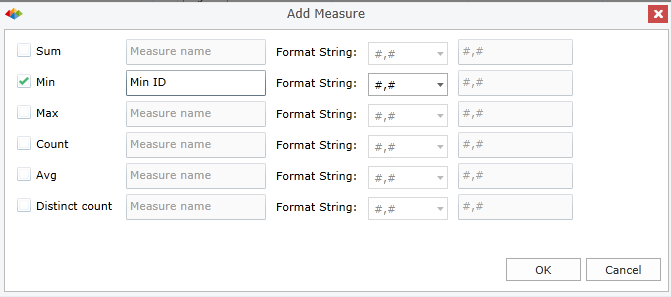
Clicking on the ellipsis button (blue arrow above), users will have an opportunity to make more advanced measure selections for the column in a pop up dialog (below):
- Users can choose to enable MULTIPLE metrics and aggregations for the column
- They can also set a custom value format option per metric
- They can change the measure's name as it appears in the model
IMPORTANT: All measures are auto-grouped into the measure group folders in data Discovery
Custom Model Measures
Often users need to generate new measures from formulae in their data models. The measures usually extend well beyond based aggregations.
You can create a custom measure formulation by clicking the "fx" button in the column selector panel (see here). A dialog box will be displayed where you can add a new measure definition - its name, formula and data format.
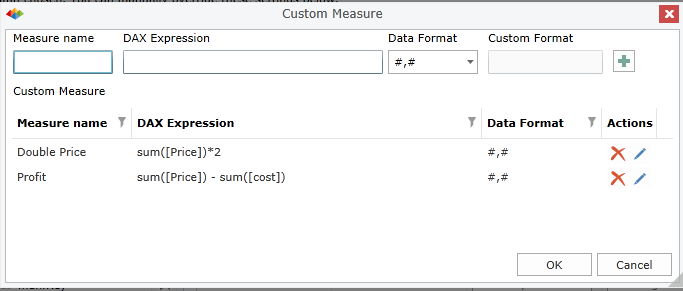
The dialog will allow you to add multiple measures per dataset table. It also provides the tools to edit existing formulae and delete unneeded measures.
Home |
Table of Contents |
Index |
User Community
Pyramid Analytics © 2011-2022