

Printing
There are 2 "soft printing" options provided by the application: to the PDF document format and to Microsoft's XPS document format. Both formats produce accurate representations of the on-screen content in a paginated format that can then be easily distributed via email or sent to a printer for physical output.
Vector Formats
Both print formats output content in vector format - which means the content is 'drawn' to the document such that it is fully scalable and "pixel perfect". (The application does not "screen scrape" content to produce lower resolution "raster" imaging, which are typically pixilated.) This makes printing suitable for high-end printing.
NOTE: Maps are produced in raster format
Printing Setup
From the Distribute backstage button, users click on the print icon in the distribution button group. This will enable users to make print setup choices AND print the content out.
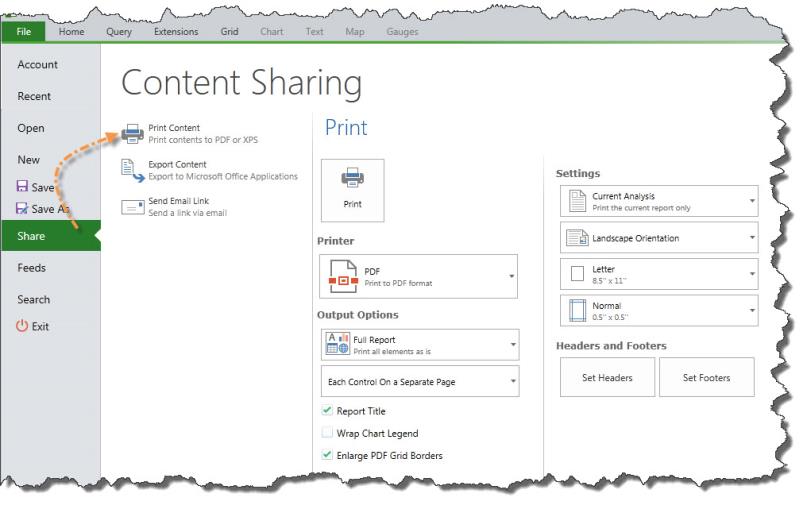
- In the backstage, users can select what type of "printer" they would like to use: PDF or XPS
- Select content to print
- Print the current analysis in the client
- Print the entire book / dashboard (based on the LAST SAVED version)
- Print specific reports / slides (based on the LAST SAVED version) by selecting the desired reports /slides from the drop down list.
- Document dimensions and orientation
- Page margins
- In the right hand panel users can set other output options:
- Elect to print all or part of the report based on its contents.
If a report does not contain certain elements, the choice is disabled
- If multiple reports or an entire book are being printed, reports are printed as is (no selections are applied)
Elect whether to show the report description (the report's title)
- Elect whether to show a selections summary for elements appearing in the filter/subset axis of the query
- Set headers and footers
Select whether to wrap chart legend so you can see all the information in one screen.
- Select whether to enlarge grid borders for PDF output.
- Elect to print all or part of the report based on its contents.
Print Headers and Footers
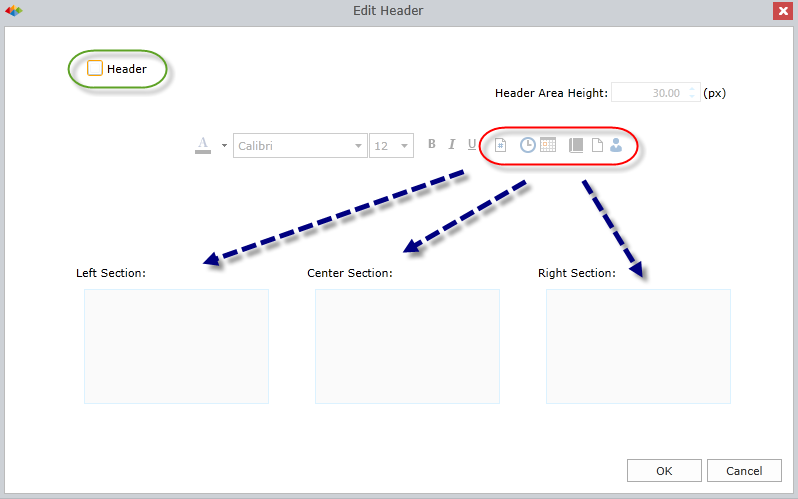
Users can customize and set the headers and footers in their output documents by clicking on the "Set Headers" and/or "Set Footers" buttons
In both dialogs:
- The user must first select whether they will be added to the document via the check box (green highlight)
- User can select how much space the header or footer will occupy at the top of the screen using the numeric up/down spinners.
- The user can then choose to manually type in text to the 3 header or footer zones: left, center and right or use the short-cut buttons to add functional representations (red highlights). To add the automated functions, users click in the zone, and then click one of the following buttons to insert the function (red arrow)
- Page Number - automated page number based on printed output
- Time and Date - automated date/time based on date/time report is printed out
- Book/Dashboard Name - automated inclusion of the current item's name
- Report/Slide Name - automated inclusion of the current report/slide name
- User Name - the name of the logged in user printing the report
- For each header/footer zone and element, users can format the text using the familiar font options (note that alignment is preset by the zone position itself)
NOTE: Once the print has begun, the users will be prompted with a spinner. Once the print is completed, users are prompted to SAVE the print file locally.
Home |
Table of Contents |
Index |
User Community
Pyramid Analytics © 2011-2022