

Lineage
The lineage framework provides users with a holistic view of their content, queries, data models and business logic in a single point and click interface. The lineage interface also includes the ability to view structural metadata, content usage, versioning and role security.
Accessing Lineage
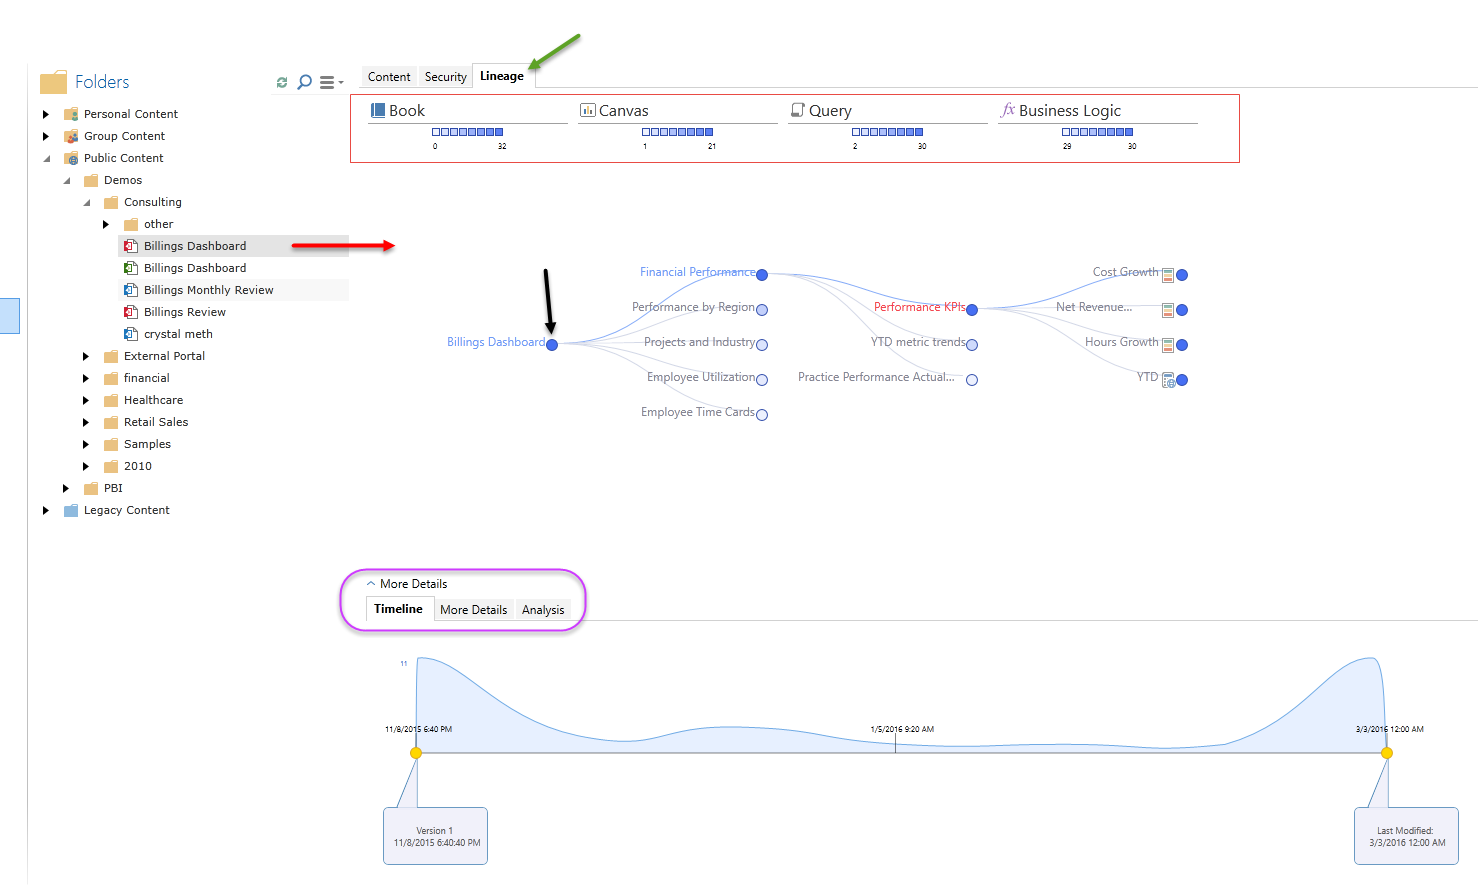
The main lineage interface is available via the content tabs in the Open page of the backstage. Clicking on an item (red arrow) and choosing the lineage tab (green arrow) will expose the base lineage tree diagram. Clicking on the primary node - the content item itself - will allow users to view how the other elements inside the BI framework are interconnected with this item (black arrow).
Other Access
The lineage diagram can be seen by right clicking on business logic items and assets in their respective trees through the application. It can also be initiated from the data model tree on the Start page (under New Data Discovery).
Lineage Node Types
The available lineage nodes are:
- Book - the main container for items (book of reports, story board of slides, publication templates)
- Canvas - the main container for queries (reports, slides, publication templates)
- Queries - the queries themselves
- Business Logic - different calculation entities like custom measures, members and sets
- Assets - graphics and other items
- Data Sources - data models and cubes
- Users - users of the system
Navigating the Lineage Dependency Tree
Clicking the primary node, the tree will expand to show dependent objects in the next panel. The next default dependent object changes depending on the node type (book, canvas, model, business logic, user or asset). To choose a specific dependency path, right click on the node and choose a specific dependent.
The tree's blue dots give a sense of usage volume. The darker the ball, the more it is used. The usage range for a given dependency node is given at the top of the diagram (red highlight below). Yellow balls denote smaller items that cannot fit in the list. Clicking on a yellow ball will shift the list to its focus.
Clicking on a node will launch the node's metadata window (purple highlight). The metadata will change depending on the node type. It can include:
- Usage statistics over time as well as the dates and times of versions
- Usage analysis - overall statistics of usage of the node by user
- More Details - general metadata of the item like create dates, descriptions and tags. It can also include formulations for business logic.
- User Access - listing of the roles that can read, write or view the item. Depending on a user's rights, these roles settings can be changed directly from this interface.
Clicking on a different node in the diagram may keep the general tree flow intact (where possible) as well as showing its metadata in the bottom section.
Home |
Table of Contents |
Index |
User Community
Pyramid Analytics © 2011-2022